
Page 8 - TCE Annual Report 2024-2025
P. 8
Overview Leadership Messages Governance Strategic Insights Business Review People & Community
Year at a
Glance
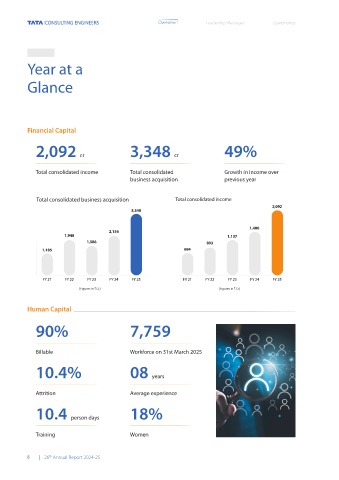
Financial Capital
49%
2,092 cr 3,348 cr
Total consolidated income Total consolidated Growth in income over
business acquisition previous year
Total consolidated business acquisition Total consolidated income
2,092
3,348
1,406
2,156
1,948 1,137
1,586 893
1,185 684
FY 21 FY 22 FY 23 FY 24 FY 25 FY 21 FY 22 FY 23 FY 24 FY 25
(Figures in ₹ Cr) (Figures in ₹ Cr)
Human Capital
90% 7,759
Billable Workforce on 31st March 2025
10.4% 08 years
Attrition Average experience
18%
10.4 person days
Training Women
8 | 26 Annual Report 2024-25
th